Your dashboard, piece by piece.
Drag widgets and arrange them to tell the story your team needs to know.
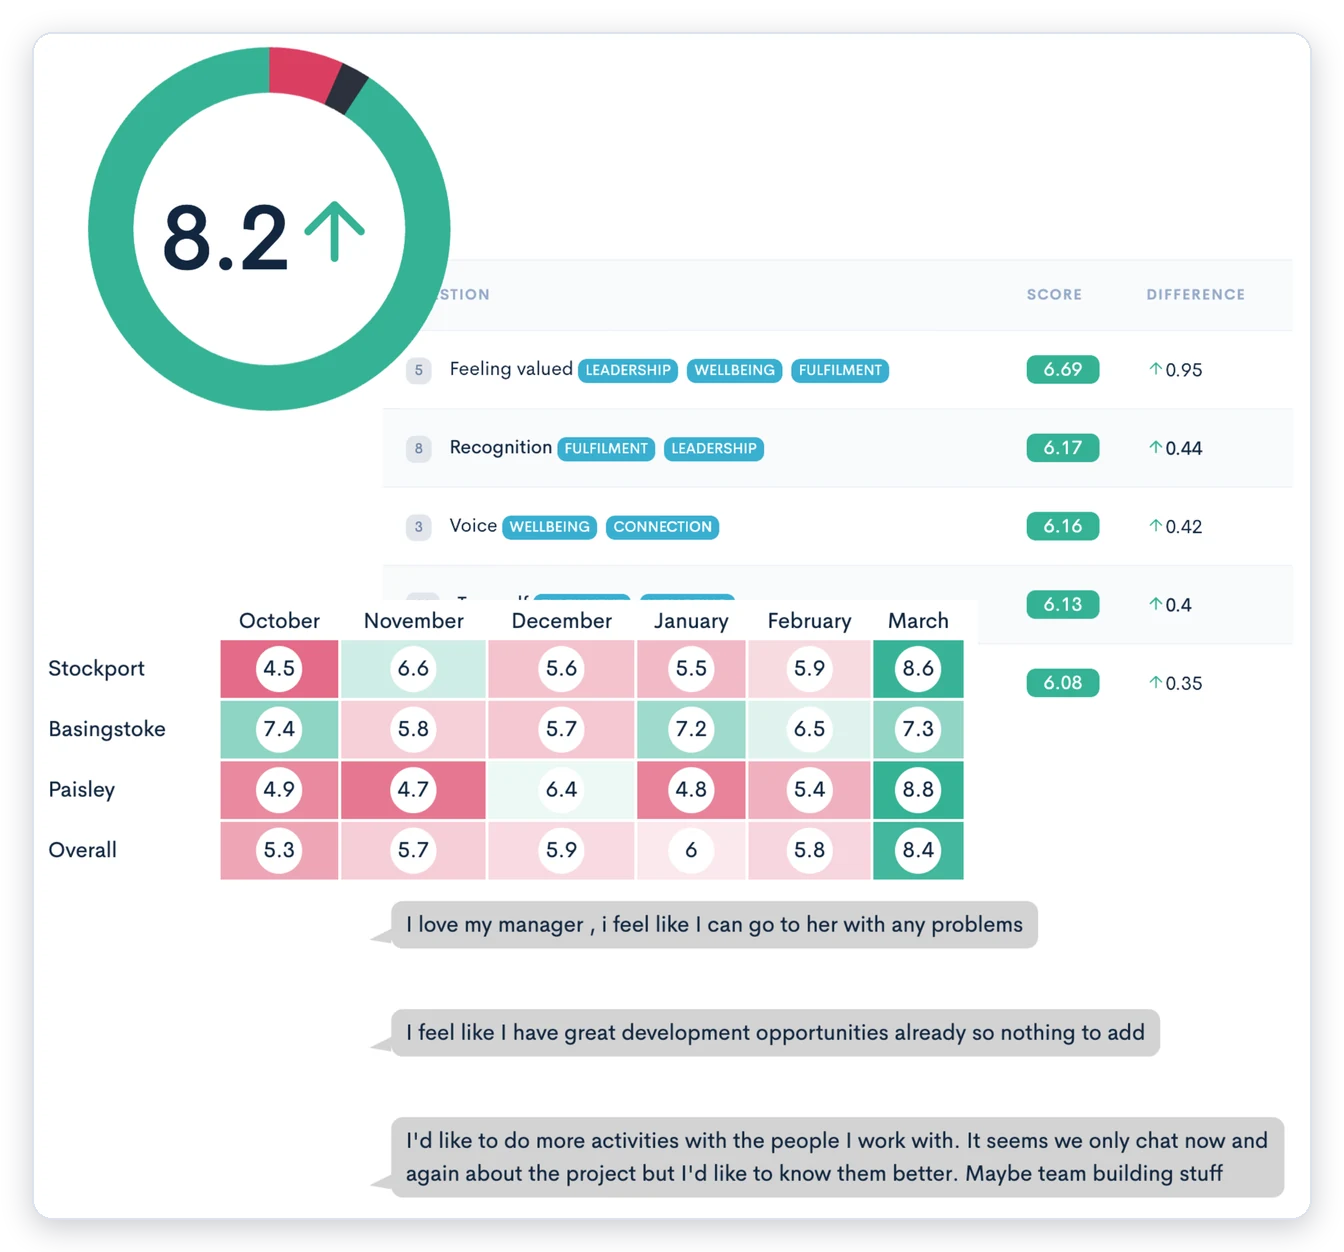
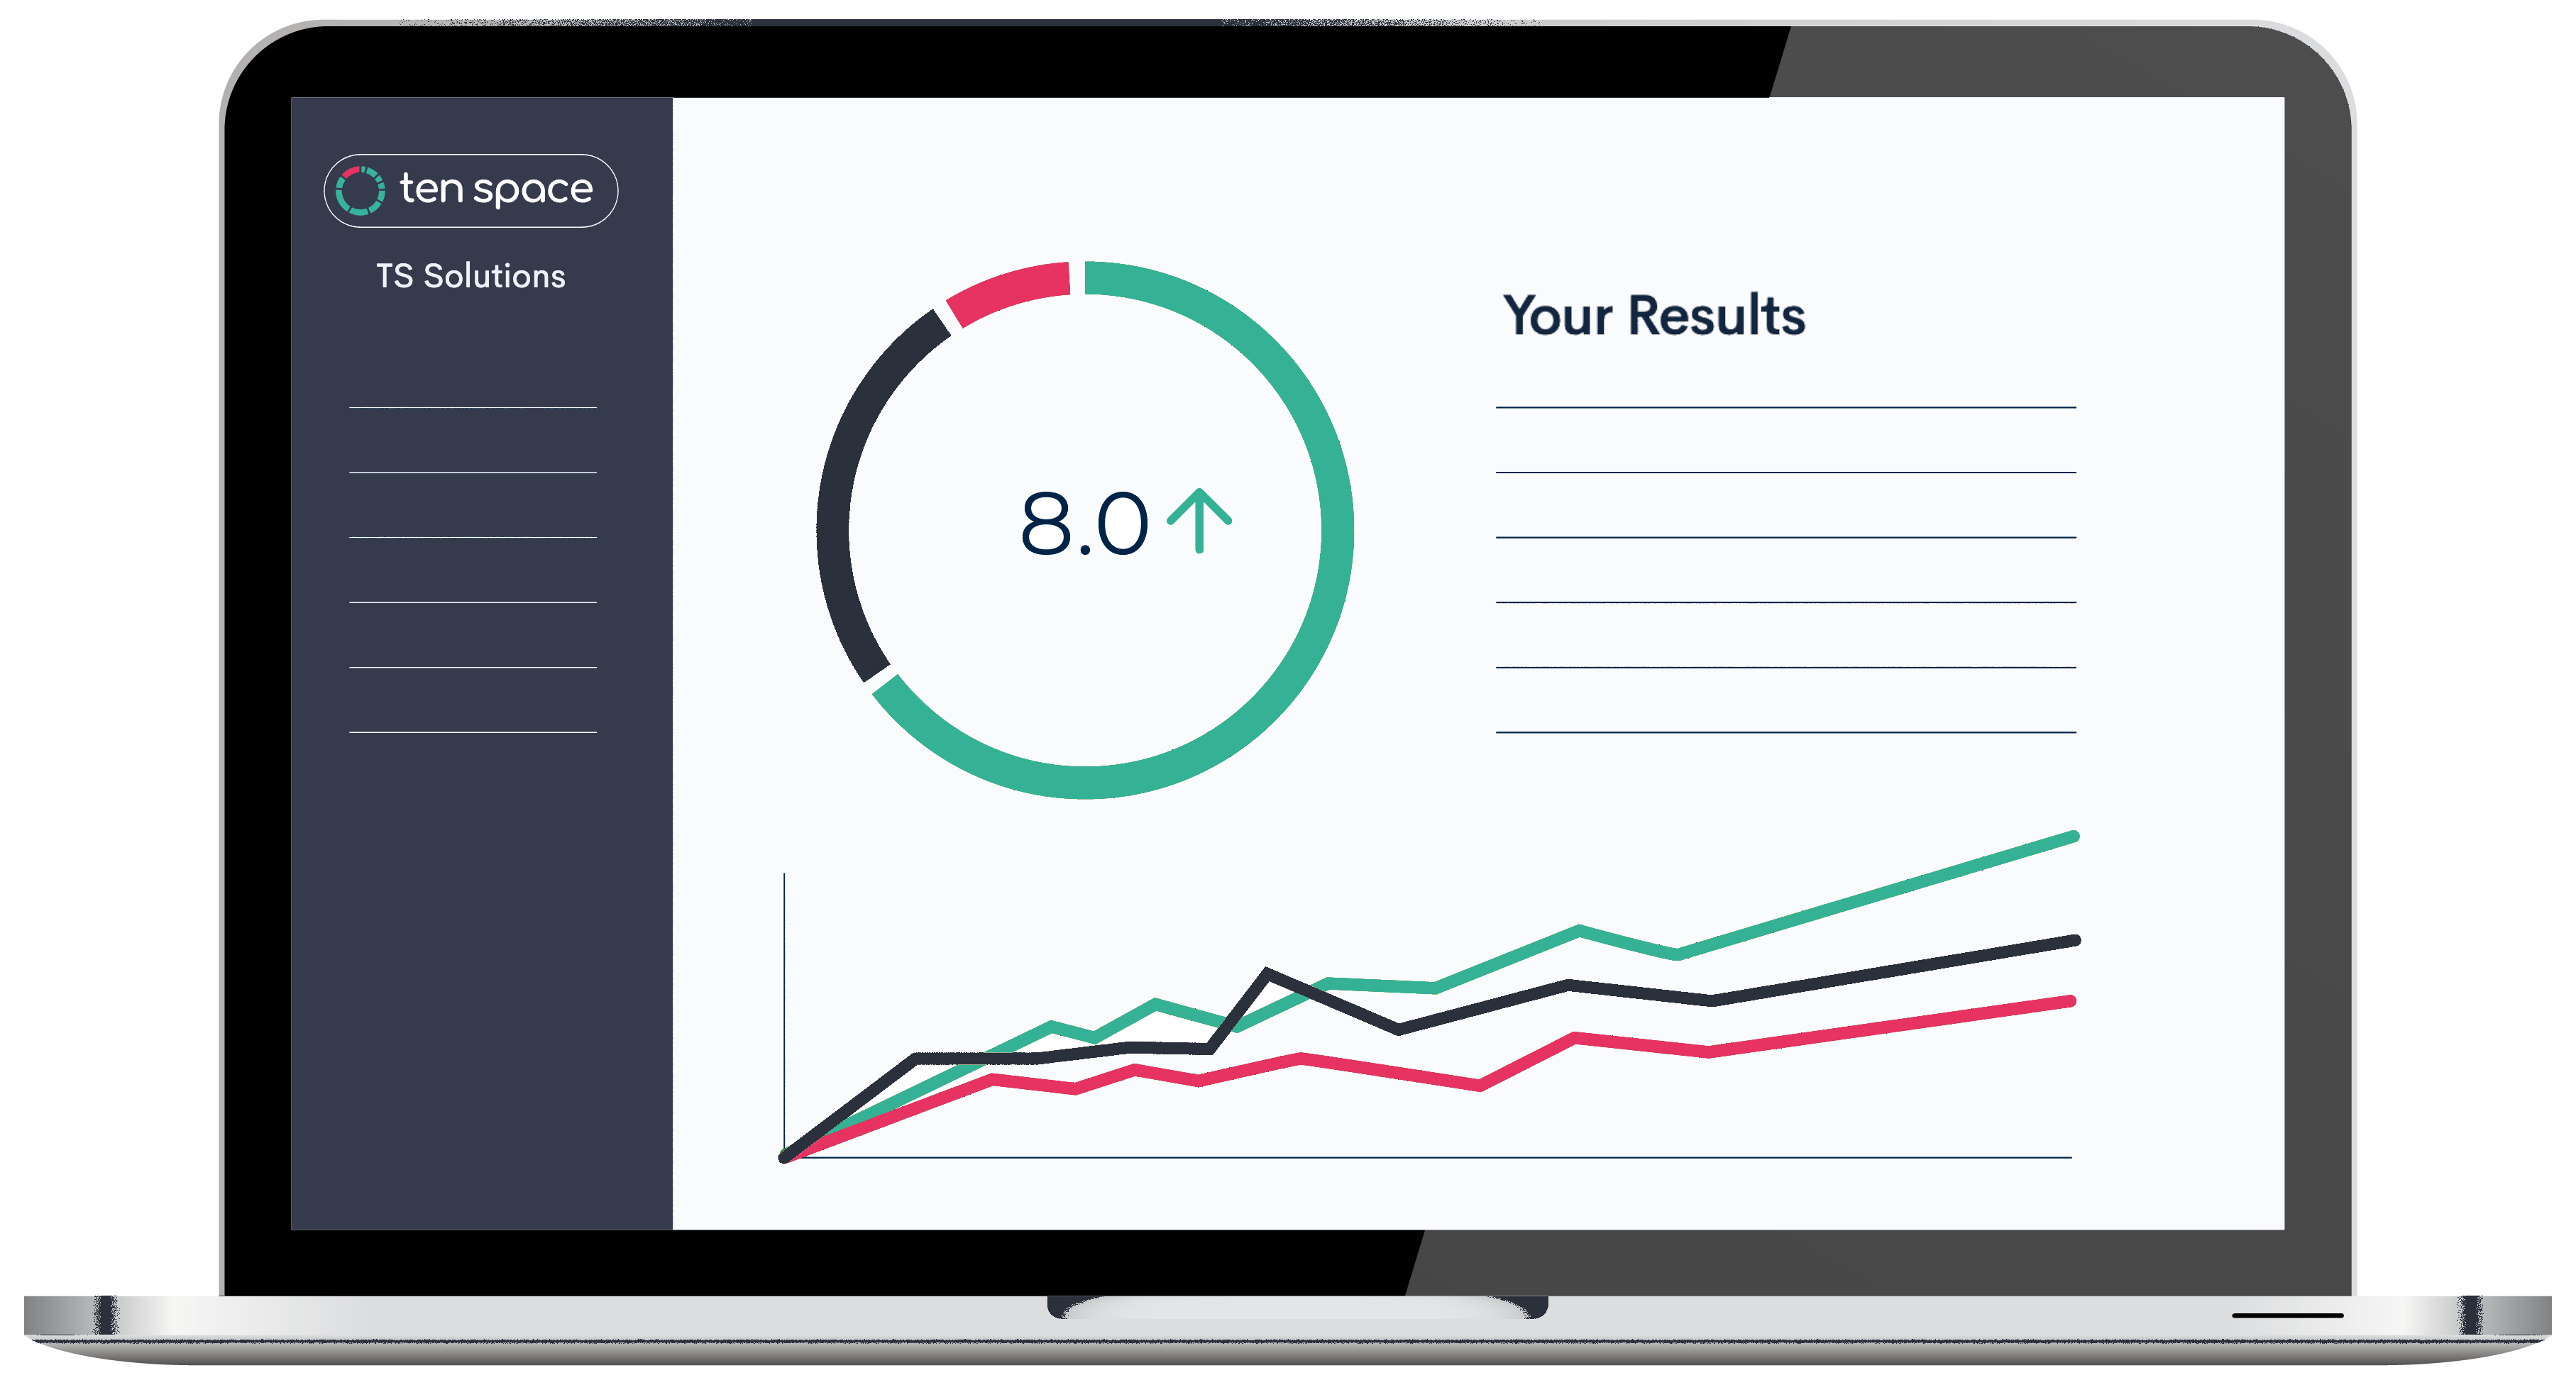
- Headline scores for a survey, a question or a pillar, with their trend, against our engagement model or your own values.
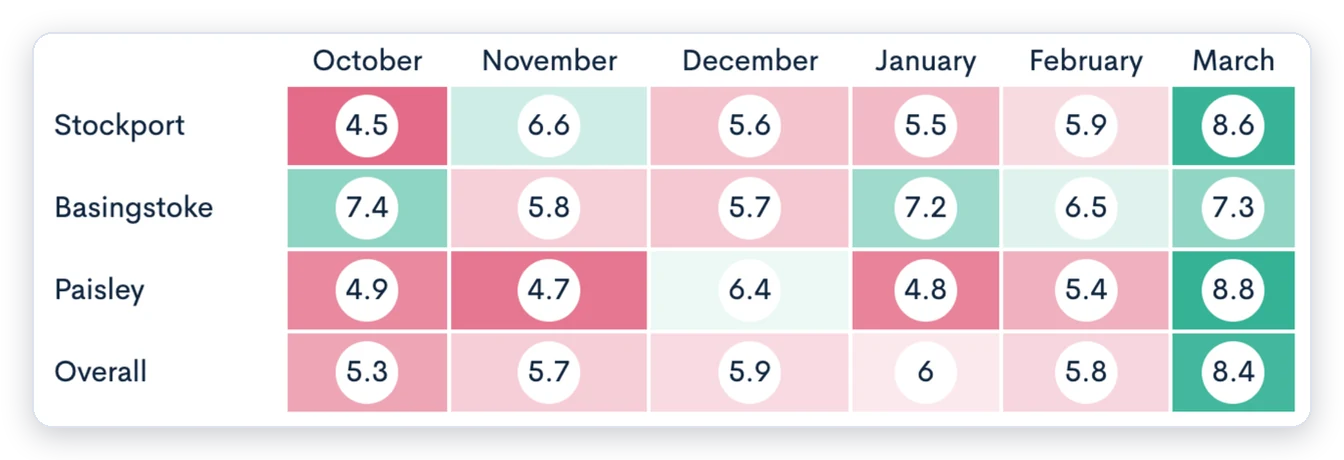
- Trends over time, and heatmaps by site, team or any employee detail.
- Leaderboards of your highest and lowest scores.
- Response rates, and how the answers to a question split.
- Comments, word clouds and AI summaries.
- Comparisons side by side: one site, team or region against another, or one survey against the last.
- Text of your own, to say what a chart shows.